Market cap bitcoin is the total dollar value of all mined BTC, calculated by multiplying circulating supply by current price. As of August 23, 2026, CoinMarketCap reported approximately $1.53 trillion and CoinGecko reported $1.528 trillion, ranking Bitcoin #1 among all cryptocurrencies.
Key Takeaways
- Bitcoin market cap equals circulating supply multiplied by current BTC price. As of August 23, 2026, that figure sits near $1.53 trillion across major data providers.
- Bitcoin dominance stands at 57.5% per CoinGecko, meaning BTC alone accounts for more than half the total crypto market.
- Fully diluted valuation (FDV) uses the 21 million hard cap rather than current circulating supply, producing a slightly higher figure than the live market cap.
- ETF inflows, corporate treasury holdings, and bank custody announcements are reshaping institutional demand and indirectly affecting cap bitcoin trends.
- Different platforms report slightly different figures due to price aggregation timing and supply methodology. Pick one source and track it consistently.
What Is Market Cap Bitcoin and Why It Matters

this type of bitcoin is the single most-cited valuation metric in crypto because it captures the full economic weight of the network, not just the price of one coin. Price alone tells you what one BTC costs today. Market cap tells you the total value the market assigns to every BTC in existence.
Definition of Market Capitalization
Market capitalization is the total dollar value of all mined coins of a cryptocurrency. According to Coinbase Learn, for a cryptocurrency like Bitcoin, market cap is calculated by multiplying the number of coins in circulation by the current market price of a single coin. The formula is straightforward: current BTC price × circulating supply. As of August 2026, Bitcoin had a circulating supply of approximately 20.07 million BTC and a price near $76,000, producing a market cap just above $1.5 trillion.
Bitcoin is the world’s first decentralized cryptocurrency, created by an individual or group using the pseudonym Satoshi Nakamoto. The Bitcoin whitepaper, “Bitcoin: A Peer-to-Peer Electronic Cash System,” was published in October 2008, and the genesis block was mined on January 9, 2009. Bitcoin operates on a proof-of-work blockchain secured by the SHA-256 cryptographic algorithm, and its fixed supply cap of 21 million coins makes it a deflationary digital asset often called “digital gold.”
How Bitcoin Market Cap Is Calculated
Bitcoin’s circulating supply is not the same as its max supply. CoinMarketCap shows a circulating supply of 20.07M BTC, a total supply of 20.07M BTC, and a max supply of 21M BTC. The fully diluted valuation uses the max supply, producing a higher figure of about $1.6 trillion. Understanding this distinction prevents overestimating the available float.
this kind of bitcoin data refreshes constantly because cryptocurrency markets trade 24 hours a day, 365 days a year. A price move of even a few dollars can shift Bitcoin’s market cap by hundreds of millions, given the large circulating supply.
Circulating vs Fully Diluted Market Cap
Circulating market cap uses coins that have been mined and are considered liquid. Fully diluted market cap assumes all 21 million BTC exist. Some platforms, like Binance, display both figures clearly. CoinGecko, by contrast, shows an FDV equal to the market cap because it uses the current circulating supply rather than the max supply for its FDV calculation. This methodological difference explains the slight variations you see across providers.
“Market capitalization (or market cap) is the total dollar value of all the shares of a company’s stock – or, in the case of Bitcoin or another cryptocurrency, of all the coins that have been mined.” – Coinbase Learn
Pros and Cons of Using Market Cap Bitcoin as a Valuation Metric

market cap is the most widely used benchmark for sizing Bitcoin’s economic footprint, but it has real limitations that any serious analyst should understand before relying on it.
Pros
- Simple and comparable. One number lets you rank Bitcoin against every other crypto asset and against traditional asset classes like gold or mid-cap equities.
- Reflects total network value. Unlike price per coin, market cap accounts for supply differences, making cross-asset comparisons meaningful.
- Widely tracked. CoinMarketCap, CoinGecko, TradingView, Forbes, and Binance all publish it in real time, so data is freely available and easy to cross-check.
- Useful for dominance analysis. Bitcoin dominance (BTC market cap as a share of total crypto market cap) is a reliable macro signal for rotation between BTC and altcoins.
Cons
- Not a measure of capital inflow. Market cap is price × supply, not the sum of money that has actually entered Bitcoin. A single large trade can reprice the entire supply.
- Ignores lost coins. Estimates suggest a significant portion of early BTC is permanently inaccessible, but those coins still count toward circulating supply and inflate the market cap figure.
- Snapshot, not a predictor. A high market cap does not guarantee future returns or protect against drawdowns. Bitcoin’s market cap fell sharply even as its long-term trajectory rose.
- Methodology varies by platform. Supply definitions and price aggregation timing differ across providers, producing figures that diverge by a small but non-trivial margin.
Current Market Cap Bitcoin Data: Live Figures from Major Platforms
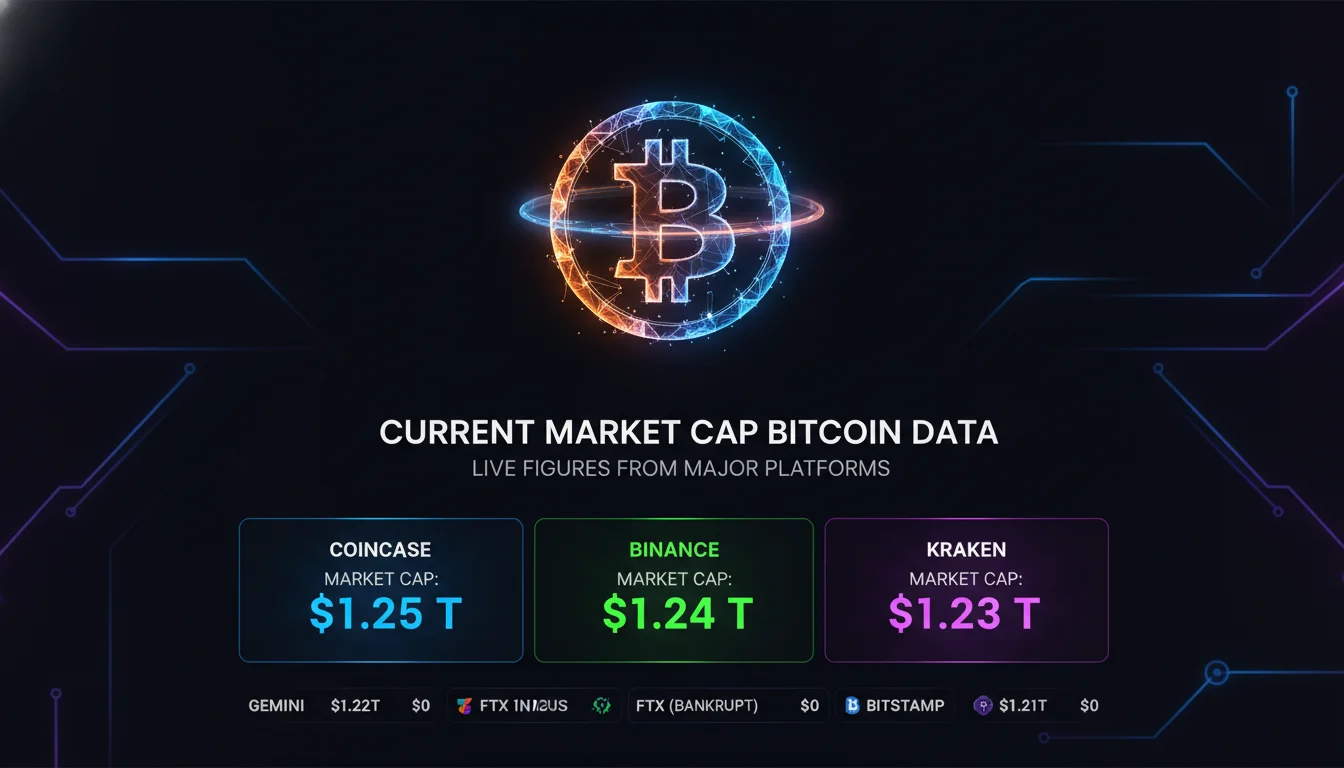
The live cap bitcoin figures across major platforms cluster tightly around $1.5 trillion as of August 23, 2026, with minor differences driven by methodology rather than fundamental disagreement.
CoinMarketCap vs CoinGecko Metrics
As of August 23, 2026, CoinMarketCap reported a live market cap of $1,527,233,711,910 USD. CoinGecko reported approximately $1.528 trillion. The two prices are close: $76,251.51 on CMC and $76,128.64 on CoinGecko. The gap stems from slight differences in reported circulating supply and the exact timestamp of price aggregation.
Both platforms rank Bitcoin #1. CoinGecko also shows Bitcoin dominance at 57.5%, with Ethereum at 10.8%, meaning Bitcoin’s market cap is more than half of the entire crypto market. That dominance figure is a useful macro signal for investors shifting between BTC and altcoins.
Forbes, Binance, and bitFlyer Data Points
Forbes Digital Assets listed Bitcoin at $76.26K with a market cap of $1.53T, while Binance rounded to $1.5T at a price of $76,090.85. Japanese exchange bitFlyer displayed a more precise market capitalization of 1,525,020,289,007.76 USD. These figures are consistent but not identical.
For commercial decision-making, pick one reliable source and track changes over time rather than worrying about small inter-platform differences. The table below summarizes key data points from major sources on August 23, 2026.
| Source | BTC Price (USD) | Market Cap | Circulating Supply | Max Supply | Fully Diluted Valuation | 24h Change |
|---|---|---|---|---|---|---|
| CoinMarketCap | $76,251.51 | $1.53T / $1,527,233,711,910 | 20.07M BTC | 21M BTC | $1.6T | +1.52% |
| CoinGecko | $76,128.64 | $1.528T | 20.072M BTC | 21M BTC | $1.528T | +1.4% |
| Forbes Digital Assets | $76.26K | $1.53T | Not shown | Not shown | Not shown | -1.54% |
| Binance | $76,090.85 | $1.5T | 20.1M BTC | 21M BTC | $1.6T | -1.42% |
| bitFlyer | $75,975.56 | $1.525T | Not shown | Not shown | Not shown | -1.89% |
Why the Numbers Differ Slightly
this type of bitcoin data varies because exchanges and data aggregators collect prices from different trading pairs at different times. Circulating supply may also be updated on different schedules. For investors, a 0.3–0.5% difference rarely matters, but referencing one consistent source is important when tracking daily or weekly changes.
How to Use Market Cap Bitcoin for Investment Decisions

this kind of bitcoin is most useful as a comparative and sizing tool, not as a timing signal. Here is how to apply it practically.
Large-Cap, Mid-Cap, and Small-Cap Classification
According to Coinbase, cryptocurrencies are classified by market cap into large-cap, mid-cap, and small-cap categories. Bitcoin is the largest large-cap crypto, followed by Ethereum at around $288.73B and Tether at $183.19B as reported by Forbes Digital Assets. Large-cap assets tend to be more stable than smaller caps, but they still experience significant volatility.
Comparing Bitcoin to Ethereum and Stablecoins
market cap dwarfs most other assets. Forbes reports Ethereum at $288.73B, Tether at $183.19B, and BNB at $91.38B. Even XRP at $91.33B and Solana at $53.98B are significantly smaller. This reinforces Bitcoin’s role as the benchmark asset, but it does not guarantee future returns. Stablecoins like Tether and USDC carry large market caps that reflect currency reserves rather than investment upside.
Market Cap vs Price: A Critical Distinction
A common mistake is assuming a lower-priced coin is cheaper than Bitcoin. Market cap accounts for total supply. Coinbase illustrates this with two fictional cryptocurrencies: Cryptocurrency A has 400,000 coins in circulation at $1 each, giving a $400,000 market cap, while Cryptocurrency B has 100,000 coins at $2 each, giving a $200,000 market cap. Even though B’s individual coin price is higher, A’s overall value is double B’s. Compare market cap, not price per unit.
Tracking Market Cap Bitcoin Over Time: Charts, Cycles, and Dominance
Tracking cap bitcoin over time reveals cycle patterns that raw price charts can obscure, particularly when you layer in dominance data and volume context.
Bitcoin Dominance and the Global Crypto Market
Bitcoin dominance measures Bitcoin’s market cap as a percentage of the total cryptocurrency market cap. CoinGecko reports BTC dominance at 57.5%, with Ethereum at 10.8%. This means BTC alone accounts for more than half of the $2.666 trillion total crypto market cap shown on CoinGecko. By comparison, Forbes listed the global crypto market cap at $2.57 trillion, a difference caused by the number of assets tracked and timing.
Historical Market Cap Trends
this type of bitcoin has not moved in a straight line. TradingView data shows Bitcoin’s market cap at $1.53T on August 23, 2026, with a year-over-year change of -34.45% and a year-to-date change of -12.74%. Over 10 years, however, the market cap is up roughly 16,500%, underscoring long-term growth despite cyclical drawdowns. The day’s range was $1.52T to $1.55T, reflecting intraday volatility.
What 2026 Data Shows
This year has been volatile. CoinGecko shows Bitcoin’s 7-day range from $62,666.84 to $79,319.57. Binance lists the all-time high at $126,198.07 from October 6, 2025, meaning Bitcoin is roughly 39.6% below that peak. For investors, tracking this kind of bitcoin against such price ranges can reveal whether volume supports price moves or whether moves are driven by thin liquidity.
“Standard Chartered’s Geoff Kendrick sees Bitcoin moving toward $126,000 by year-end” – Binance News, August 2026
Bitcoin Halving Cycles and Their Effect on Market Cap
Bitcoin’s halving mechanism is one of the most direct structural forces acting on market cap over time. Every 210,000 blocks, the block reward paid to miners is cut in half. This reduces the rate at which new BTC enters circulation, tightening supply issuance on a predictable schedule.
The most recent halving reduced the block reward to 3.125 BTC. With roughly 20.07 million BTC already mined out of the 21 million hard cap, the remaining supply will be issued over a very long tail, with the final satoshi not expected until around 2140. Each halving cycle has historically preceded a period of price appreciation, which in turn drives cap bitcoin higher, though past cycles do not guarantee future outcomes.
For builders and investors, the halving schedule matters because it affects miner economics. As block rewards shrink, transaction fees must eventually compensate miners for securing the network. This dynamic has implications for Bitcoin’s long-term security budget and, by extension, the network’s ability to maintain the trust that underpins its market cap.
Market Cap Bitcoin and Institutional Products: ETFs, Treasuries, and Custody
Institutional infrastructure around Bitcoin has expanded significantly in 2026, and these developments create new demand vectors that interact with this type of bitcoin in ways that differ from retail buying.
Spot Bitcoin ETF Flows
Institutional flows shape sentiment around this kind of bitcoin. According to CoinMarketCap, U.S. spot Bitcoin ETFs saw $1.92 billion inflows in a strong trading week, and separately drew $1 billion in three days as regulatory clarity boosted demand. These flows contribute to demand pressure, but they do not directly change market cap unless prices move. ETF inflows are a leading indicator of institutional appetite, not a direct market cap input.
BlackRock’s $285 million investment led a $517 million inflow into U.S. spot Bitcoin ETFs on August 19, 2026, highlighting strong institutional interest. On-chain data and ETF flow trackers confirm this trend is not isolated to a single week.
Corporate and National Treasury Holdings
Treasury holdings are separate from circulating supply but signal conviction. CoinMarketCap lists Bitcoin Treasury Holdings at 1.34M BTC, while CoinGecko reports total treasury holdings of 1,901,980 BTC. El Salvador, for example, holds 7,751.37 BTC according to TradingView news. These holdings reduce the effective liquid supply, which can amplify price moves and affect market cap calculations over time.
Banks Entering Crypto Custody
According to CoinMarketCap, Citi plans to offer direct Bitcoin custody for clients by 2026, and JPMorgan Chase will accept Bitcoin as collateral for loans. These developments may support long-term cap bitcoin growth by increasing mainstream accessibility and reducing friction for large capital allocators.
Step-by-Step: How to Evaluate Market Cap Bitcoin Before You Buy
Evaluating this type of bitcoin properly requires more than glancing at a single number. Follow these steps to build a complete picture before committing capital.
Step 1: Define Your Investment Goal
Decide whether you are adding Bitcoin as a long-term store of value, a trading position, or a portfolio hedge. this kind of bitcoin is most useful for sizing a position relative to total portfolio risk, not for short-term timing. Write down your target holding period and risk tolerance before comparing assets.
Step 2: Compare Market Cap Across Assets
Use data from at least two sources, such as CoinMarketCap and CoinGecko. Note Bitcoin’s market cap, Ethereum’s market cap, and stablecoin market caps. This tells you the relative size and liquidity of each asset. A larger market cap generally indicates deeper liquidity and broader adoption, but it does not eliminate volatility.
Step 3: Check Circulating Supply and Fully Diluted Valuation
Look at circulating supply and FDV. A large gap between current market cap and FDV can indicate future supply unlocks, though Bitcoin has a hard cap of 21M BTC with no unlocks. For Bitcoin, the gap between the $1.53T circulating market cap and the $1.6T FDV is small and will narrow over time as mining continues.
Step 4: Monitor Volume and Volatility
24-hour volume and the Vol/Mkt Cap ratio matter. CoinMarketCap shows Bitcoin volume at $31.86B and Vol/Mkt Cap at 2.09% on August 23, 2026. Low volume can exaggerate price swings, while high volume supports price discovery. Pair volume data with market cap bitcoin trends before executing a trade.
Common Misconceptions About Market Cap Bitcoin
Several persistent misunderstandings cause investors to misread market cap bitcoin data. Clearing them up is worth the time.
Market Cap Is Not Money Inflow
Many assume market cap equals cash invested. In reality, market cap is a valuation snapshot: price × supply. It does not represent total capital that has entered Bitcoin. A $10 million buy can move market cap by more than $10 million if it pushes the price up, because the entire supply is repriced at the new marginal price.
Bitcoin Price vs Value
A low price per coin does not make a cryptocurrency undervalued. Because supply differs across assets, market cap is the correct comparison. Bitcoin at $76,000 with 20.07M supply has a market cap near $1.53T. A token priced at $1 with a circulating supply of 1 trillion would have the same market cap but far different risk, adoption, and liquidity characteristics.
Fully Diluted Valuation Misunderstandings
Some sources show Bitcoin’s FDV at $1.6T while others show $1.528T. The discrepancy arises from using max supply versus circulating supply. Bitcoin’s max supply is fixed at 21 million, so FDV will eventually converge toward the max supply price if all coins are mined, which will not happen until around 2140. Do not confuse FDV with current invested capital.
Where to Find Reliable Market Cap Bitcoin Data and Tools
Reliable market cap bitcoin data is freely available, but knowing which tools to use for which purpose saves time and prevents errors.
Primary Data Aggregators
CoinMarketCap and CoinGecko are the most widely used aggregators. CoinMarketCap provides detailed exchange order books, treasury holdings, and a profile score for Bitcoin. CoinGecko offers on-chain treasury data, dominance metrics, and a community sentiment gauge. Both are free and update in real time, making them essential for tracking market cap bitcoin.
Exchange and Charting Platforms
Binance and bitFlyer provide market cap bitcoin figures alongside buy-and-sell interfaces. TradingView shows market cap as a chartable metric, which is useful for technical analysis. For API access, developers can query CoinGecko or CoinMarketCap endpoints to build automated tracking dashboards.
Educational Resources
For conceptual clarity, Coinbase Learn explains market cap categories and calculation. Forbes Digital Assets and Binance Academy offer additional context. Always cross-check definitions when comparing data from different providers, because supply methodology and price indexing can vary.
Using Market Cap Bitcoin as a Decision-Making Framework
Market cap bitcoin works best as one input in a broader analytical process, not as a standalone buy or sell signal.
Summary of Key Findings
The market cap bitcoin data on August 23, 2026 clusters around $1.5 trillion, with Bitcoin ranked #1 by all major platforms. Different sources show minor variations due to methodology, but the takeaway is consistent: Bitcoin remains the largest and most dominant crypto asset. CoinGecko’s 57.5% dominance figure confirms its benchmark status across the entire crypto market.
Actionable Next Steps
Choose one primary data source for ongoing tracking, set price and market cap alerts, and review Bitcoin dominance quarterly. Pair market cap bitcoin metrics with fundamentals like ETF inflows, treasury holdings, and macroeconomic conditions before making commercial decisions. Rebalance positions based on your original risk framework, not short-term market cap fluctuations.
Limitations to Keep in Mind
Market cap is a snapshot, not a predictor. It does not account for lost coins, illiquid treasury holdings, or future regulatory changes. Use it as one input among many in your investment process, alongside on-chain analytics, volatility measures, and broader portfolio context.
If you are building a protocol, treasury strategy, or tokenomics model that needs to account for Bitcoin’s market position, apply to the Genesis Cohort at digitalblockchains.com. We work with serious builders who want depth, not surface-level takes.
Frequently Asked Questions
What is Bitcoin market cap?
Bitcoin market cap is the total dollar value of all mined BTC, calculated by multiplying the circulating supply by the current BTC price. It ranks Bitcoin as the largest cryptocurrency by valuation, sitting near $1.53 trillion as of August 2026.
How is Bitcoin market cap calculated?
Multiply the circulating supply of Bitcoin by its current price in USD. For example, 20.07 million BTC at approximately $76,000 equals a market cap of about $1.53 trillion. The formula is the same one used for traditional equities: shares outstanding times price per share.
Why do different platforms show different Bitcoin market cap figures?
Platforms use slightly different price sources, update times, and supply definitions. These minor variations can cause a 0.3–0.5% difference in reported market cap bitcoin values, which is rarely significant for investment decisions but matters when tracking precise daily changes.
Is a high market cap good for Bitcoin?
A high market cap generally signals greater liquidity, adoption, and relative stability compared to smaller assets, but it does not guarantee returns or prevent price volatility. Bitcoin’s market cap fell sharply from its all-time high of $126,198.07 in October 2025 to roughly $1.53 trillion by August 2026.
What is the difference between market cap and fully diluted valuation?
Market cap uses circulating supply, while fully diluted valuation uses the maximum supply of 21 million BTC. Bitcoin’s FDV is approximately $1.6 trillion per CoinMarketCap, slightly higher than its current circulating market cap. The two figures will converge as mining continues toward the 21 million cap over the coming century.
Where can I check Bitcoin market cap live?
You can check live market cap bitcoin data on CoinMarketCap, CoinGecko, Forbes Digital Assets, Binance, and TradingView. Each provides real-time or near-real-time figures, and all ranked Bitcoin #1 as of August 23, 2026.